5 ways to implement best practices of Data Analytics
According to a research, companies using analytics for decision making are 6% more profitable than those that don’t. Companies now want to be proactive and predictive. They don’t want to pile up data but use it in the form of analysis and interpretation. Companies are now understanding the importance of data analytics. They want to use their data to unleash actionable insights that will help them grow their businesses. But you can’t just input data into a business intelligence tool and expect remarkable results.
You may be comfortable in creating tables and charts to present your visuals but data analytics is more than that. Whether you are analysing the data for marketing segmentation, demand forecasting, or any other purpose, you need to follow the best practices to ensure that you get in-depth data-driven results.
1. Choose the key metrics
There are numerous metrics available in an analytical tool but every business has different requirements. Not all the metrics are useful for your business. So, before starting data analysis, it’s important to decide on the metrics that are meaningful to your business. For instance, if you’re analysing your advertising spends and customer data to know the ROI of marketing spend, conversion rates and sales data are very valuable.
Eliminating inessential data will simplify your task and provide you with the better results. Ask yourself these questions when assessing which metrics to focus on:
- Why have you collected the data?
- Will this data help you in achieving business goals? How?
2. Avoid common data modelling mistakes
If data is not modelled correctly, you will not get the output you want. To get the effective insights from your data, make sure avoid common data modelling errors. In analysis, even a small source of data can be important. Ignoring them, applying poor naming standards, not knowing which metrics to use, etc. are the small errors you need to evade. If you don’t, your data models would be rather confusing than helpful. Make up your mind what you expect from that data, especially when merging data from numerous sources.
3. Create relevant dashboards
Dashboards help you to interact with your data even if you don’t have technical know-how. But just making fancy visualizations and dashboards should not be the priority. Rather they should be helpful to all those who rely on the data and seek in-depth outputs. Showing complex analytics is a challenge as you need to decide upon the type of dashboard, its design and the metrics to include. But proper planning and practice will help you in creating relevant, logical and yet simplified dashboards.
4. Choose the Correct Tool
There are many BI tools available in the market. They might all seem similar but they vary from one another in many ways. Their framework, specialities, functionalities, visualizations, industry focus, etc. differ. Look for a solution that matches your needs and can handle even the most complex data while still providing clear insights understandable by non-technical users.
Choose an all-in-one tool that helps you in data analysis, visualization, sharing and accessing the data from anywhere, any device.
5. Select the right visual for your purpose
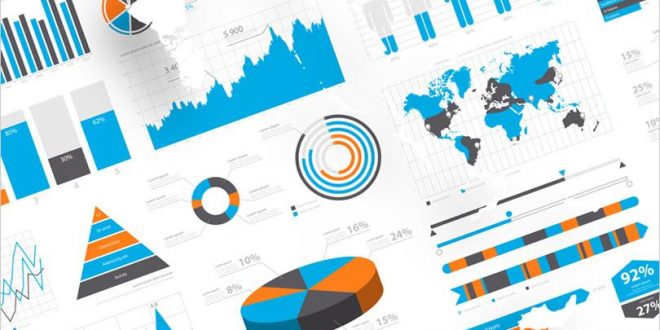
You might choose the right analytics tool but what if you don’t choose a proper visual? You will not be able to analyse the data and get the right information. There is a reason why there are so many types of visuals available. Every chart or visual has its own speciality. Choose what works best for the data type on hand. For instance, line charts track changes or trends over time and show the relationship between two or more variables while bar charts compare quantities of various categories.
With more and more businesses relying on data analytics tool for decision making, it is important that they do it the right way. By implementing a data analytics tool and its best practices, you can streamline your business processes.
Get in touch with Intech for more information on data analytics.
About Intech
Intech Systems is a three-cloud Microsoft-certified partner that boasts deep expertise in providing digital transformation solutions for organizations by leveraging the Microsoft 365, Dynamics 365, and Azure solution stack. Intech is recognized as a top-tier Microsoft implementation partner globally and specializes in transformative technology solutions such as ERP (Enterprise Resource Planning), CRM (Customer Relationship Management), Business Process Automation, Business Intelligence, Cloud Infrastructure, Data Management, Productivity & Collaboration and Generative AI (Gen-AI) solutions. As a trusted Microsoft Solutions Partner, we are capable of doing complex technology implementations catered to an organization’s specific needs & also rapid solution implementation such as our Microsoft Dynamics 365 Business Central implementation packages. We pair our implementations with end-to-end customer support, offshore development & 3rd party integrations. With offices in India, USA (United States of America), and Singapore, we work with clients across globe to empower businesses with cutting-edge technology solutions. Our latest services aim at delivering business ready AI solutions to the customer, like our Microsoft Copilot Consulting Services & Solutions for small, medium & large enterprises. Intech’s expertise lies in building software solutions for Manufacturing, Professional Services & Healthcare. Our Dealer Management System, Sales and Service CRM for Manufacturing, Field Force Automation for Pharmaceuticals and Manufacturing Central are some of our leading industry solutions. Intech’s vision is to catalyze digital futures for operation-centric industries globally, we are at the forefront of innovation, helping organizations drive growth and innovation like never before. Contact Us to learn more.
Recent Post


How can we help? - Talk to Dynamics 365 experts for your concerns
What's New

QuickBooks vs Dynamics 365 Business Central: Which Is Better for Business Scalability
Introduction Today’s needs vs tomorrow’s growth. A battle, organizations, small and big, fight daily. The...

Modernizing Manufacturing ERP Systems with AI Intelligence
A success story on transforming manufacturing operations, productivity, and decision-making at scale Manufacturing ERP transformation...

How JK Fenner Modernized Dealer Management with Microsoft Dynamics 365
Manufacturers with large dealer networks know the struggle well. Keeping hundreds of dealers connected, informed,...


